
Fitbit PowerBI Report
- IT_Nurse

- May 17, 2021
- 2 min read
Updated: Dec 19, 2024


When I first started learning PowerBI at work, I immediately realized it would solve some issues I was having with managing some of my personal data at home. For example, I was using Excel to bring my data out of the Fitbit portal so that I could create my own visualizations that made more sense to me (and were therefore more motivating) than what was available through Fitbit.
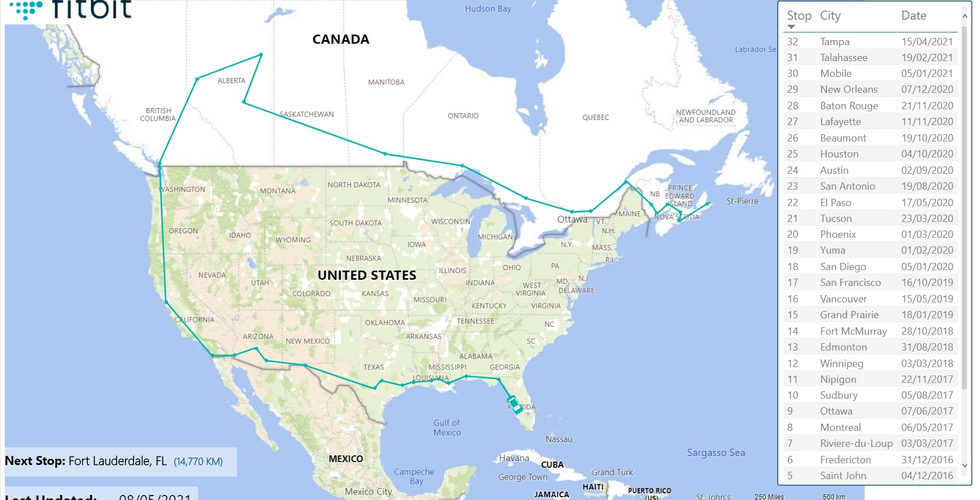
I'm now on my 2nd iteration of the report, and while there's still definitely things I'd like to change, I'm pretty happy with it. I'm especially pleased with the map (I'm almost to Tampa!) and the mountain climb (only 2 summits left to go!).
Pretty much all the changes have to do with increasing automation / decreasing how much "hands on" time I spend updating it. For example:
I would love to learn about APIs, to see if I could find a way to have a '1-click refresh'
There's some calculations / transformations I didn't know how to do when I originally built it, and I haven't had time to go back and redo them. So there's a manual piece to both the map and the mountain components.
When I started the dashboard (in 2018), the pup had just joined our fam, and my daily steps were ASTRONOMICAL. The crazy increase that came from chasing a new puppy really directed some of the visuals / metrics that I chose. And even as the pup grew and we got into a routine, I was still logging 90,000 - 120,000 steps PER WEEK. However, when the world stopped in 2020, so did the routine, and now I'm lucky to see 80,000 steps in a week. So the entire report could use a redesign, but I'd like to accomplish the other two items first.
So that's it! If you have any questions about how it all works, please feel free to reach out. And until then, thanks for reading!
Take care,
IT_Nurse

Comments